Contents
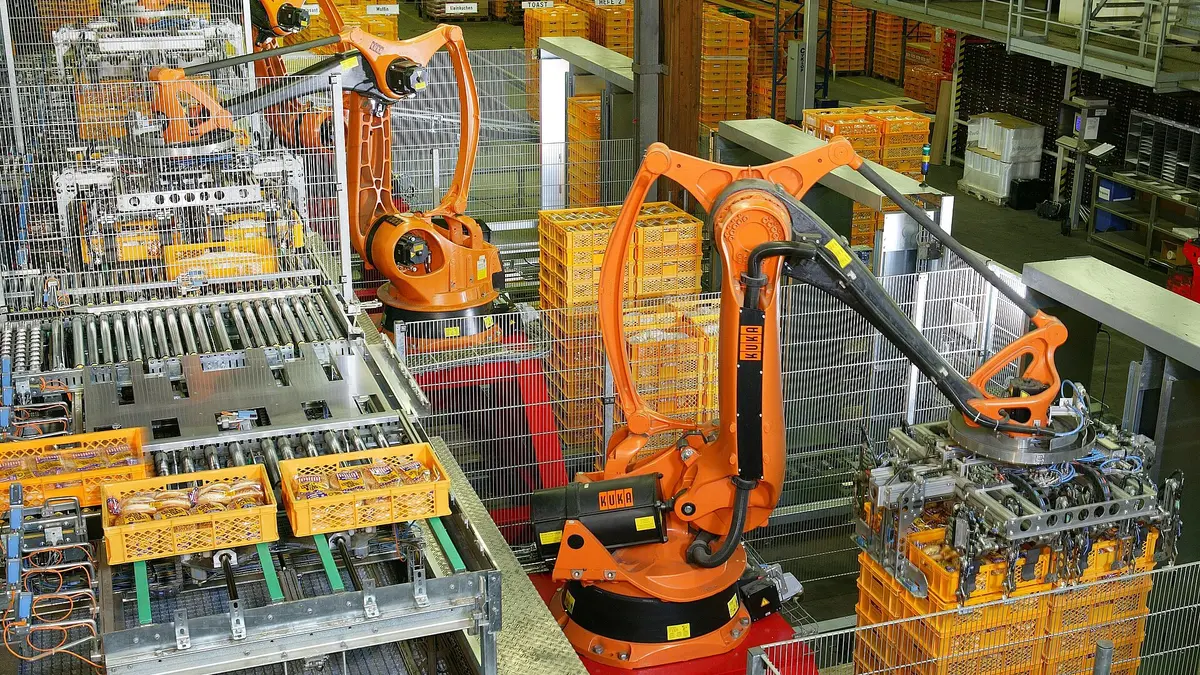
The robots that matter most to the economy do not walk or talk. They are mechanical arms bolted to factory floors, welding car bodies, placing components on circuit boards and stacking boxes. The International Federation of Robotics (IFR), the industry’s trade body, counts them every year. Its latest report puts the number in operation above five million for the first time.
What counts as an industrial robot
The IFR’s figures cover industrial robots: programmable machines, usually arms with several joints, used in manufacturing. They do not include robot vacuum cleaners, warehouse delivery carts or surgical systems, which are counted separately as service robots. The numbers come from robot makers and national robotics associations, so they record sales by the industry’s own members.
Two measures are used throughout. Installations are the new robots put to work in a year. Operational stock is the total in use, new and old.
The headline numbers
The World Robotics 2026 report gives these figures for 2025.
Installations had been stuck at around 550,000 a year for four years. The 2025 figure passed the previous record, set in 2022, by 9%. The IFR says the number in operation has more than doubled in seven years, and expects it to pass six million in 2028.
Where the robots are going
Three quarters of them go to Asia, and most of those go to one country.
| Region | Installed | Change on 2024 |
|---|---|---|
| Asia | 457,315 | Up 14% |
| Europe | 73,054 | Down 14% |
| The Americas | 57,044 | Up 14% |
China installed 354,226 robots, 20% more than the year before and 59% of the world total. A growing share of them are made there. Chinese brands supplied around 30% of the country’s installations between 2019 and 2021. Since 2024 they have supplied more than half.
| Country | Installed | Change on 2024 |
|---|---|---|
| China | 354,226 | Up 20% |
| United States | 38,428 | Up 12% |
| Japan | 36,219 | Down 19% |
| South Korea | About 30,000 | Down 1% |
| Germany | Under 25,000 | Down 8% |
The United States overtook Japan to become the second-largest market. Germany remains the largest in Europe, with 41% of the European Union’s installations. Europe as a whole had what the IFR calls a weak year, which it puts down partly to low demand from carmakers.
China installed 59% of the world’s new industrial robots in 2025, and Chinese brands now supply more than half of them.”
Which industries use them
For decades the car industry bought the most robots, and its investment cycle set the pattern for the whole market. That is no longer true. In 2025:
- Electrical and electronics manufacturers installed 142,235 robots, up 10%, and were the largest customer for the second year running.
- Carmakers and their suppliers installed 138,429, also up 10% and a record.
- Metal and machinery firms installed 108,571, up 22%, or 18% of the total.
Robot density: who is most automated
Raw totals favour big countries. A fairer comparison is robot density, the number of industrial robots for every 10,000 people employed in manufacturing. The IFR’s most recent density figures are for 2024, a year behind the installation data.
| Country or region | Robots | World rank |
|---|---|---|
| South Korea | 1,220 | 1 |
| Singapore | 818 | 2 |
| Germany | 449 | 3 |
| Japan | 446 | 4 |
| United States | 307 | 8 |
| China | 166 | 22 |
| Western Europe | 267 | Not ranked |
| World average | 132 | Not ranked |
Two things stand out. South Korea has more than one robot for every ten manufacturing workers, nearly three times the level in Germany. And China, despite buying most of the world’s robots, ranks 22nd, because its manufacturing workforce is so large. The IFR notes that its China figure uses updated employment data from the country’s statistics bureau.
The release does not give a figure for the United Kingdom.
| Item | Robots |
|---|---|
| South Korea | 1,220 |
| Singapore | 818 |
| Germany | 449 |
| Japan | 446 |
| United States | 307 |
| China | 166 |
| World average | 132 |
Source: International Federation of Robotics. Chart: The Sidelight.
What about humanoid robots?
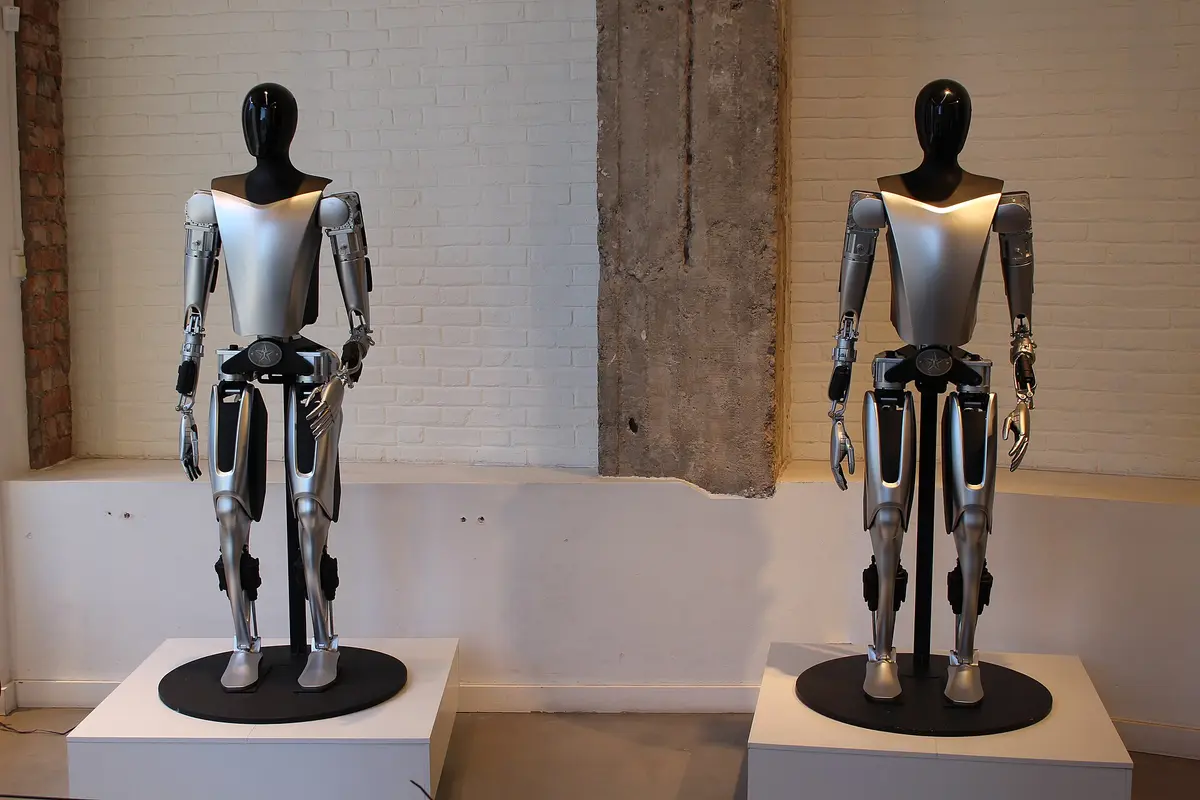
Robots shaped like people get most of the publicity. The IFR’s assessment of them is cautious. Its 2026 report says most humanoids “remain prototypes or pilot-stage technologies” and that, for now, conventional industrial robots are economically superior for production tasks. It expects wider use to depend on large improvements in reliability, safety, operating time and cost.
Artificial intelligence is making a difference in less visible ways. The report describes machine vision, which lets a robot find and identify parts with cameras, as established and ready for industry. It says general-purpose AI systems that learn physical tasks from simulation and experience are not yet at that stage.
What the numbers do not show
- They do not show jobs lost or gained. A count of robots says nothing by itself about employment. That depends on what the robots do, and what the firms that buy them do next.
- They come from the industry. The IFR represents robot makers, and its forecasts have an optimistic audience. The historical counts are more dependable than the projections.
- A robot is not a fixed unit. A small arm that helps a worker assemble parts and a large one that lifts a car body each count as one.
- Density depends on the employment figure. China’s revised number shows how much a change in the workforce estimate can move a country’s rank.
The direction is not in doubt. Factories are adding robots at a record rate, the growth is concentrated in Asia, and Europe’s share is shrinking.
References and sources
- 01Executive Summary, World Robotics 2026: Industrial Robots · International Federation of Robotics · September 2026
- 02Five Million Robots now Operate in Factories Globally · International Federation of Robotics · 24 September 2026
- 03Robot Density Surges in Europe, Asia, and Americas · International Federation of Robotics · 8 April 2026
- 04Lead image: Factory Automation Robotics Palettizing Bread.jpg · KUKA Roboter GmbH, via Wikimedia Commons (public domain) · Accessed 13 November 2026
House byline
Articles under this byline are researched and drafted with AI assistance, with every figure checked against its source before publication. The editor, Pankaj Guleria, reviews them and corrects them where needed.
Edited by Pankaj Guleria, Founder and Editor