Contents
For most of the space age, a new satellite was a rare event. Now around ten are launched every day. The European Space Agency (ESA), which keeps one of the most detailed public records of what is in orbit, counts thousands of working satellites and a far larger number of dead ones, spent rocket parts and fragments. This article sets out the numbers and what they mean.
The count
ESA’s Space Debris Office publishes a running tally. These were its figures on 2 November 2026.
So roughly four in five of the satellites still up there are working. The remaining 3,800 or so are dead: out of fuel, broken or switched off. A satellite with no power cannot steer out of the way of anything.
The pace of launching explains why the working share is so high. ESA’s 2026 Space Environment Report says more than 300 launches carried over 4,000 new payloads into space during 2025. A payload is the useful object a rocket carries, in most cases a satellite.
| Item | Number, November 2026 |
|---|---|
| Objects tracked in orbit | About 47,390 |
| Satellites ever launched | About 28,570 |
| Satellites still in space | About 19,610 |
| Satellites still working | About 15,800 |
Source: European Space Agency. Chart: The Sidelight.
Why there are suddenly so many
The growth comes from constellations: large groups of similar satellites, run by one operator, that work together to provide internet connections or to photograph the Earth. A single constellation can contain thousands of satellites. ESA says the number and scale of commercial constellations keep increasing every year.
Most of them fly in low Earth orbit, the region up to about 2,000 kilometres above the surface. Satellites there are close enough to give fast connections, and cheap enough to reach that operators can replace them often. ESA’s full report identifies the band between 400 and 600 kilometres as the one with the highest concentration of active satellites that can manoeuvre.
The debris you cannot see
Satellites are the minority of what is in orbit. Tracking networks on the ground follow about 47,390 objects, three times the number of working satellites. The rest are dead satellites, discarded rocket stages and fragments.
Even that is only what can be tracked. Smaller pieces are too small to follow individually, so ESA estimates them with a statistical model.
| Size | Estimated number |
|---|---|
| Larger than 10 cm | 68,450 |
| 1 cm to 10 cm | 1.5 million |
| 1 mm to 1 cm | 230 million |
Size is misleading here. Objects in low Earth orbit travel at several kilometres a second, so even a small fragment hits with enough energy to damage or destroy a satellite, and a collision creates more fragments.
ESA’s model counts about 11,300 active payloads among the objects larger than 10 centimetres. That is lower than the 15,800 functioning satellites in its running tally. The two figures come from different methods and dates, and ESA does not reconcile them on the page. It is a reminder that every count of objects in orbit is an estimate.
Satellites are the minority of what is in orbit. Tracking networks follow about 47,390 objects, three times the number of working satellites.”
Where the debris comes from
Collisions between satellites are not the main source so far. ESA’s report says fragmentations other than collisions are currently the dominant source of debris. These are mostly explosions, caused by leftover fuel or batteries in old satellites and rocket stages. On average over the past two decades there have been 9.8 accidental fragmentations a year. In 2024, breakups linked to propulsion systems added more than 3,000 tracked fragments. The year 2025 added comparatively few.
The long-term fear is a chain reaction, in which debris from one collision causes others, each creating more debris. ESA’s report states: “Even if no new satellites were launched, the debris population would continue to increase.” Fragments are being created faster than the thin upper atmosphere drags them back down.
ESA has also begun publishing a single health score for the orbital environment, measured against a benchmark for sustainable use. That score went from about 4 to about 50 in one year, which ESA describes as roughly ten times worse.
What is being done
Removing satellites sooner. For years the international guideline was that a satellite in low Earth orbit should come down within 25 years of finishing its work. ESA and others have moved to a five-year target. The agency reports that compliance is improving, helped by constellations whose satellites fly low and can steer themselves down.
Controlled re-entries. More than three intact satellites or rocket bodies now fall back to Earth every day on average. Operators increasingly bring rocket stages down deliberately over empty ocean. ESA says the share of rocket bodies disposed of this way has risen from 10% to more than 65% in a decade, and controlled re-entries outnumbered uncontrolled ones for the second year running in 2025.
Dodging. Operators of working satellites receive warnings of close approaches and move out of the way. That works only for objects that are tracked and satellites that can still manoeuvre.
ESA’s judgement is that this is not yet enough. Its report says current levels of compliance with debris guidelines are “insufficient” for a sustainable environment in the long term.
So is space crowded?
Not in the everyday sense. Low Earth orbit is an enormous volume, and satellites are tiny within it. The risk comes from speed and from time. Everything is moving fast enough for any collision to be destructive, and ESA notes that debris in higher orbits lingers for a very long time.
Three limits apply to all of these figures. The counts depend on tracking networks that cannot see small objects. The estimates for small debris come from a model, and they jumped between ESA’s 2024 and 2026 versions. And ESA is one source, though a well-placed one, with its own interest in funding for debris work.
The numbers to watch are the ones ESA updates each year: how many fragmentations occurred, what share of satellites were removed on time, and whether its health score improves or gets worse.
References and sources
- 01Space Environment Statistics: space debris by the numbers · European Space Agency, Space Debris Office · Updated 2 November 2026
- 02ESA Space Environment Report 2026 · European Space Agency · 14 September 2026
- 03ESA’s Annual Space Environment Report, issue 10 · European Space Agency, Space Debris Office · 1 May 2026
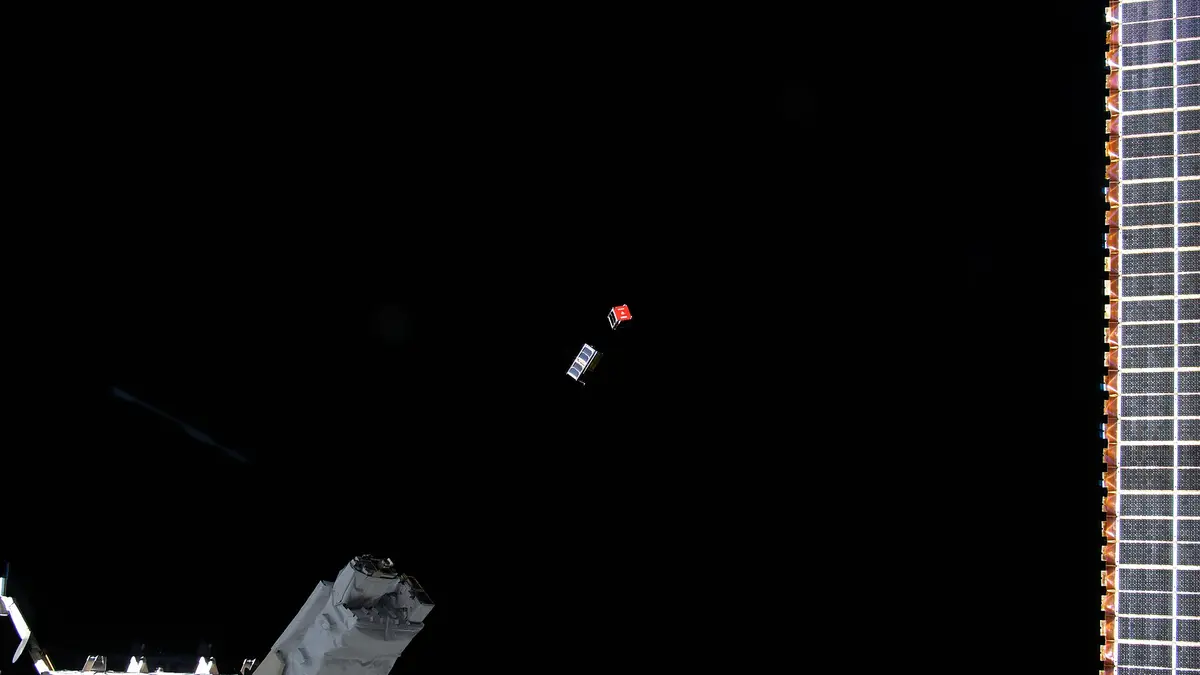
- 04Lead image: A pair of CubeSats is deployed into Earth orbit outside of the International Space Station (iss074e0301064).jpg · NASA, via Wikimedia Commons (public domain) · Accessed 13 November 2026
House byline
Articles under this byline are researched and drafted with AI assistance, with every figure checked against its source before publication. The editor, Pankaj Guleria, reviews them and corrects them where needed.
Edited by Pankaj Guleria, Founder and Editor