Contents
Inflation is the rate at which the prices of things households buy rise or fall. It is usually quoted as a percentage change over 12 months. If inflation is 3.6%, a typical set of purchases that cost £100 a year ago costs about £103.60 today. Prices are still rising when inflation falls; they are only rising more slowly.
This article is general information, not personal financial advice.
The latest UK figures
The Office for National Statistics (ONS) publishes the official figures every month. Its bulletin for October 2026, released on 18 November, is the most recent at the time of writing. The November figures are due on 16 December.
| Measure | October 2026 | September 2026 |
|---|---|---|
| CPI | 3.6% | 3.5% |
| CPIH | 3.7% | 3.6% |
| Core CPI | 2.8% | 2.8% |
| RPI | 4.2% | 3.9% |
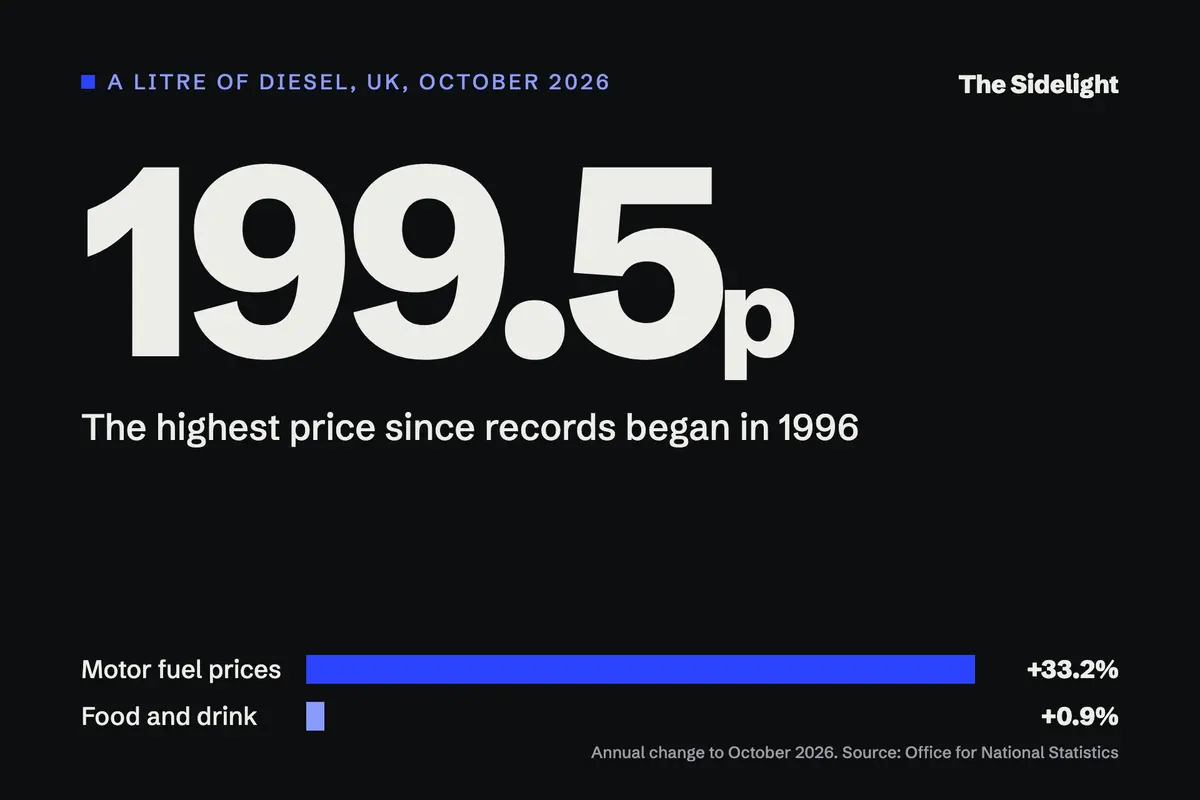
Transport, and motor fuels in particular, pushed the rate up most. Petrol and diesel prices were 33.2% higher than a year earlier, and diesel averaged a record 199.5p a litre, as we explain in our analysis of the October figures. Food and non-alcoholic drinks rose by a much smaller 0.9%. “Core” inflation strips out energy, food, alcohol and tobacco, whose prices swing the most, to show the steadier underlying trend.
| Item | % change over 12 months |
|---|---|
| RPI | 4.2% |
| CPIH | 3.7% |
| CPI | 3.6% |
| Core CPI | 2.8% |
Source: Office for National Statistics. Chart: The Sidelight.
How the basket of goods works
The ONS cannot track the price of everything, so it tracks a sample, known as the basket of goods and services. The 2026 basket contains 760 items chosen to represent what households spend money on.
The basket is reviewed once a year so that it keeps up with spending habits. In 2026 the ONS added 27 items and removed 19. Houmous, non-alcoholic beer, pet grooming and dashboard cameras came in. Premium bottled lager bought in pubs went out. The ONS says the choice of items remains partly a matter of judgement.
Each month the ONS gathers about 180,000 price quotes, according to its methodology guide. Collectors visit about 20,000 shops in around 150 places across the UK. Other prices come from central sources, and since early 2026 supermarket till records, known as scanner data, have covered about half of the groceries market.
Not every item counts equally. Each one is given a weight that reflects its share of household spending. A rise in petrol prices moves the index far more than a rise in the price of houmous. The weights are also updated each year. The result is an index, a single number that tracks the cost of the whole basket over time. The inflation rate is the percentage change in that index over 12 months.
A rise in petrol prices moves the index far more than a rise in the price of houmous.”
CPI, CPIH and RPI: three measures, three answers
The UK publishes three main measures of consumer price inflation. They use much of the same price data but differ mainly in how they treat housing.
- CPI, the Consumer Prices Index. This is the measure used for the Government’s inflation target and for uprating state pensions and benefits. It leaves out the costs of owning a home, and Council Tax.
- CPIH, the Consumer Prices Index including owner occupiers’ housing costs. This is CPI plus Council Tax and an estimate of what it costs to own and live in your own home. The ONS has treated it as its lead measure since 2017. The housing estimate uses “rental equivalence”: what an owner would have to pay in rent to live in a home like theirs. It does not track house prices. These housing costs make up 16.5% of the CPIH basket by weight.
- RPI, the Retail Prices Index. This is the oldest of the three, and the ONS no longer regards it as reliable. It lost its status as a National Statistic in 2013.
The ONS has set out its objections to the RPI in detail. Its judgement is blunt: the RPI is “a very poor measure of general inflation”. The main problem is the formula used to average prices, which the ONS estimated adds about 0.7 percentage points a year compared with CPIH. The RPI also uses house prices to stand in for some housing costs, which the ONS considers a serious weakness.
The RPI survives because long-term contracts and some government bonds, called index-linked gilts, are tied to it. That is due to change. The UK Statistics Authority has said it can bring the methods and data of CPIH into the RPI in February 2030. When that plan was announced in 2020, parts of it were subject to judicial review.
The 2% target
The Government sets the Bank of England an inflation target of 2%, measured by CPI. The Bank’s main tool for meeting it is the interest rate it sets.
The target is not zero. The Bank’s explanation is that high or unpredictable inflation makes it hard for businesses to set prices and for households to plan, while very low or falling prices can lead people to put off spending.
If CPI inflation moves more than one percentage point from the target in either direction, so above 3% or below 1%, the Bank’s Governor must write a public letter to the Chancellor explaining why and what the Bank will do about it. At 3.6%, the October figure is above that threshold.
Why your own inflation rate differs
The headline rate describes an average basket. No household buys exactly that basket. Someone who drives long distances felt the rise in fuel prices far more than someone who does not own a car. A household that spends a large share of its income on food saw a different picture again.
The ONS measures some of these differences in a separate series, the Household Costs Indices. Unlike CPI, these include mortgage interest payments, and they weight items by what an average household spends. In the year to June 2026, costs rose most for private renters and least for people who own their home outright.
These figures carry a caution. The ONS labels them official statistics in development, which means the methods are still being tested and the numbers may be revised. They also cover an earlier period than the latest CPI release, so the two sets of figures should not be compared directly.
The limits of any single number
Every inflation measure rests on choices: which items to include, how to weight them and how to treat housing. That is why three official measures gave three different answers for the same month. The headline CPI rate is a sound guide to what is happening to prices across the economy. It is a less precise guide to what is happening to any one household’s bills.
References and sources
- 01Consumer price inflation, UK: October 2026 · Office for National Statistics · 18 November 2026
- 02Diesel has never cost more. That’s why UK inflation rose to 3.6% · The Sidelight · 20 November 2026
- 03Consumer price inflation, UK: September 2026 · Office for National Statistics · 21 October 2026
- 04Consumer price inflation basket of goods and services: 2026 · Office for National Statistics · 16 March 2026
- 05Consumer Price Inflation (includes all 3 indices: CPIH, CPI and RPI) QMI · Office for National Statistics · 25 March 2026
- 06Shortcomings of the Retail Prices Index as a measure of inflation · Office for National Statistics · 8 March 2018
- 07Response to the joint consultation on reforming the methodology of the Retail Prices Index · UK Statistics Authority · 25 November 2020
- 08Inflation and the 2% target · Bank of England · Accessed 12 November 2026
- 09Household Costs Indices for UK household groups: April to June 2026 · Office for National Statistics · 28 August 2026
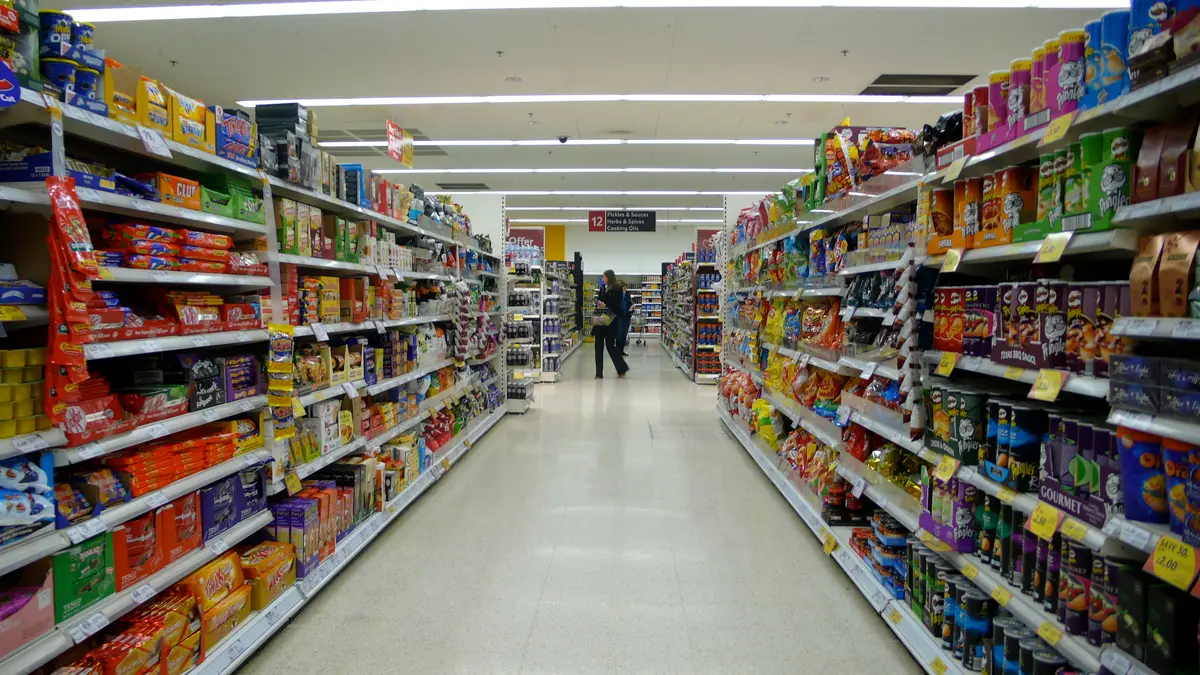
- 10Lead image: 2008-03-26 Interior of Tesco, Earl's Court, London.jpg · yisris, via Wikimedia Commons (CC BY 2.0) · Accessed 13 November 2026
House byline
Articles under this byline are researched and drafted with AI assistance, with every figure checked against its source before publication. The editor, Pankaj Guleria, reviews them and corrects them where needed.
Edited by Pankaj Guleria, Founder and Editor